
CCRES
share to you
U.S. Solar Market Insight 2012 Q1
U.S. Solar Market InsightTM is a quarterly publication of the Solar Energy Industries Association (SEIA)® and GTM Research. Each quarter, we survey nearly 200 installers, manufacturers, utilities, and state agencies to collect granular data on photovoltaic (PV) and concentrating solar. These data provide the backbone of this Solar Market InsightTM report, in which we identify and analyze trends in U.S. solar demand, manufacturing, and pricing by state and market segment. We also use this analysis to look forward and forecast demand over the next five years. As the U.S. solar market expands, we hope that Solar Market InsightTM will provide an invaluable decision making tool for installers, suppliers, investors, policymakers and advocates alike.INTRODUCTION
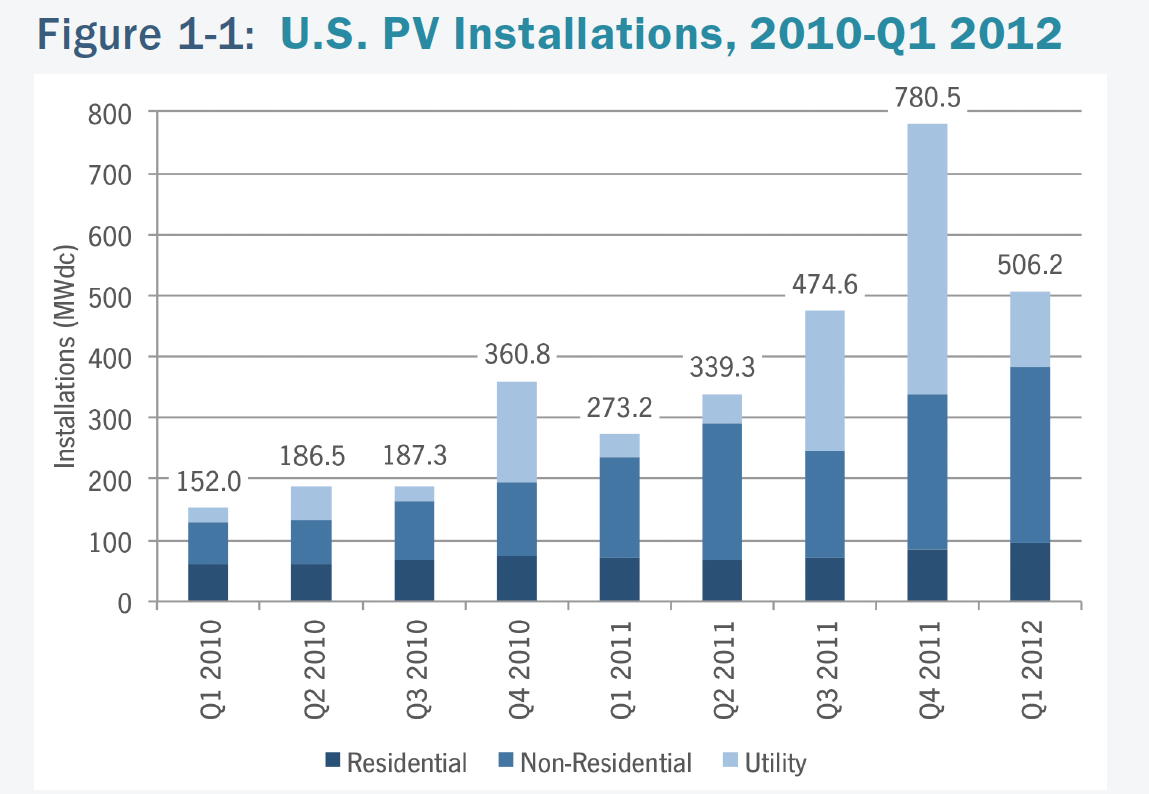
The U.S. began 2012 with the second highest quarter for installations ever. Over 18,000 photovoltaic (PV) systems totaling 506 megawatts (MW) came online in the first three months of the year. This strong showing in the U.S. came amidst turmoil in the global solar industry. Germany and Italy were both locked in discussions to revise their respective feed-in tariff programs. Project developers in both countries rushed to complete installations ahead of tariff reductions, while suppliers benefited from a short-term burst of orders that has lasted into the second quarter.
Marking a shift from an almost exclusive focus on exports, shipments into the Chinese market were at an all-time high, but at such low prices that the market served as little more than a way to allocate otherwise-unsold inventory. Meanwhile, the U.S. maintained its status as a consistently growing, albeit complex, demand center for PV. Despite uncertainty surrounding the availability of project finance, import tariffs, and state-level demand (all of which are discussed in more detail in subsequent sections), the residential and non-residential markets in aggregate grew 35% quarter-over-quarter.
As a result of strong first half demand and shipments in the first half of the year, and accelerated project development timelines for utility-scale projects (discussed in greater detail in Section 2.2), the outlook for 2012 has improved and installations will likely total 3.3 GW. Given GTM Research’s global installation forecast of 29.9 GW, the U.S. market share of global installations will reach nearly 11% in 2012, up from 7% in 2011 and 5% in 2010. This will make the U.S. the fourth-largest global PV market and one of the few major markets (along with China, India and Japan) that can expect continued growth for the foreseeable future.
KEY FINDINGS
Photovoltaics (PV)
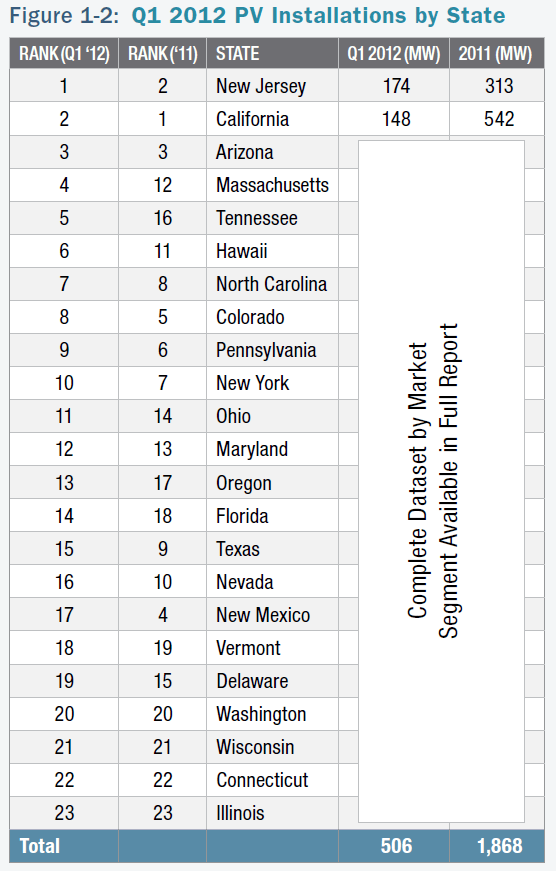
• PV Installations in Q1 2012 reached 506 MW, up 85% over Q1 2011• New Jersey was the largest state market, with 174 MW of installations in Q1 2012
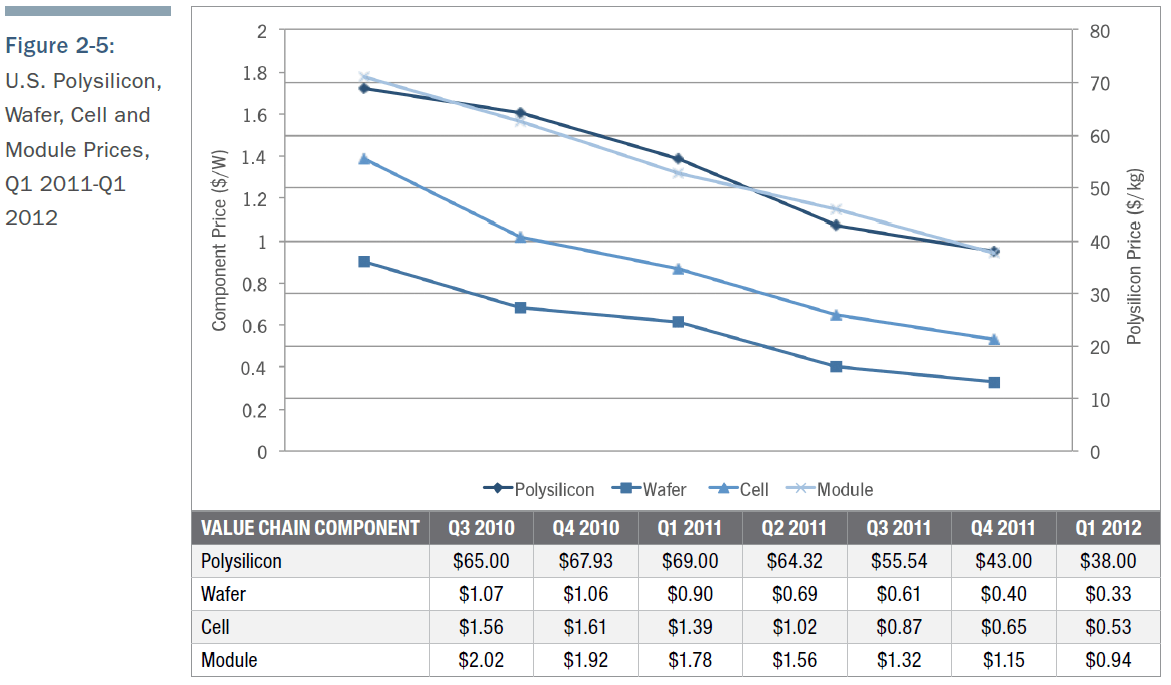
• Pricing for polysilicon and PV components continued to exhibit softness in Q1 2012 due to the persistence of the global oversupply environment that the industry has faced since early 2011. Blended module prices for Q1 2012 were down to $0.94/W, a staggering 47% lower than Q1 2011 levels of $1.78/W
• Installed prices fell in every market segment year-over-year compared to Q1 2011. Residential installed prices fell 7.3 percent, commercial installed prices fell 11.5 percent, and utility prices fell 24.7 percent over Q1 2011. The overall blended average installed price fell 17.2 percent year-over-year
• Cumulative operating PV capacity in the U.S. now totals 4,427 MWdc
Concentrating Solar Power (CSP and CPV)
• Abengoa’s Solana Generating Station received a $125 million investment from Capital Riesgo Global, a subsidiary of Banco Santander, for an equity stake in the project• Construction of the Power Tower at the Crescent Dunes Solar Energy Project was completed in February 2012
• A total of 1.3 GWac of concentrating solar is now under construction
PHOTOVOLTAICS
Photovoltaics (PV), which convert sunlight directly to electricity, continue to be the largest component of solar market growth in the U.S.INSTALLATIONS
The U.S. installed 506 MW of PV in Q1 2012, up 85% from Q1 2011. While installations were down from the 781 MW installed in Q4 2011, direct comparisons between these two quarters carry little meaning. The utility market accounted for the decline between Q4 2011 and Q1 2012 (443 MW and 124 MW, respectively). Construction timelines for a relatively few large projects can cause large swings from quarter to quarter more than any underlying market dynamics. A total 1.8 GW of utility PV will likely be connected in 2012, more than double the 2011 total, but the vast majority of that capacity will be completed in the second half of the year.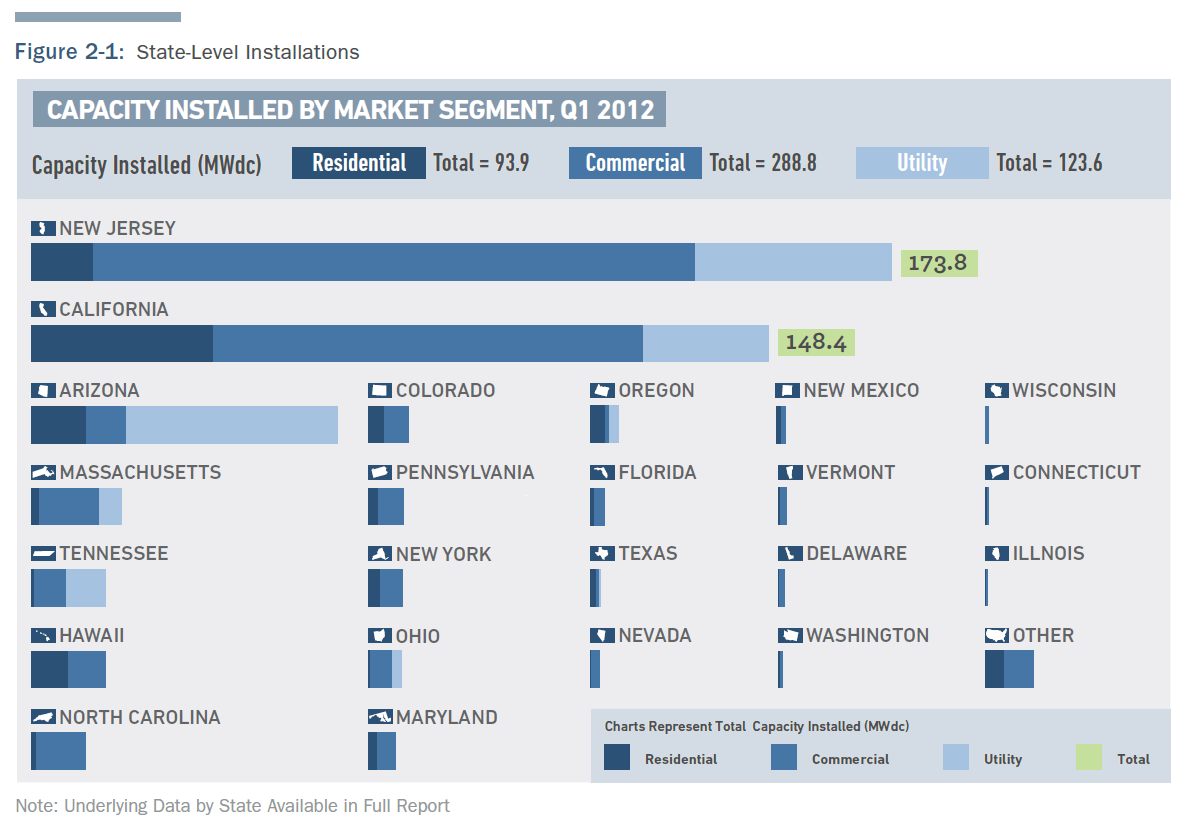
Broadly, three major factors have impacted installation totals in the first quarter of 2012:
1. Seasonality – As noted, the first quarter is generally the smallest in the U.S. market in terms of activity. This is due to adverse weather conditions in the northern part of the country and a seasonal overhang from the rush to complete projects by the end of the previous year. Installation totals will grow throughout the year.
2. Expiration of the Section 1603 Treasury Program and Safe Harbored Products – As we have noted in previous editions of this report series, it was a common strategy at the end of 2011 to ‘safe harbor’ either modules or inverters in order to qualify for the Section 1603 Treasury Program before its expiration. At least 1 GW of modules was safe harbored, and that product is currently being allocated to individual projects.
3. Import Tariff – The pending preliminary decision on the anti-dumping portion of the trade petition filed by SolarWorld created a great deal of uncertainty in the U.S. market in Q1 2012. Anecdotally, a number of Chinese suppliers offered ‘tariff-proof’ modules by being the importer of record and taking on the tariff risk themselves. This is reflected in the Q1 tariff charges that were announced by a number of suppliers in their quarterly earnings following the preliminary determination. Apart from this, developers report having shifted some procurement to non-Chinese producers.
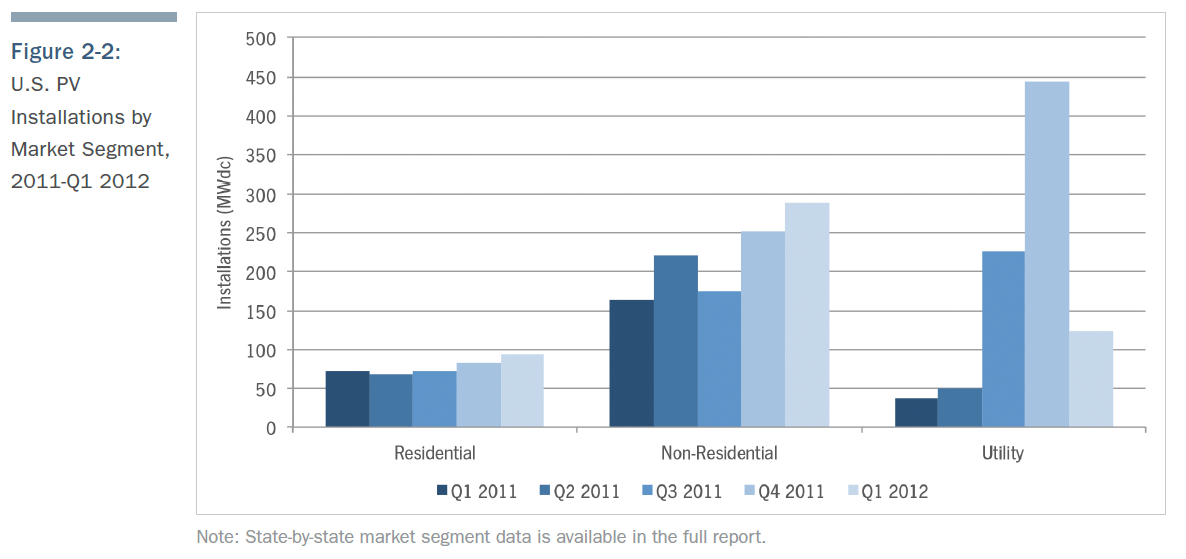
Residential installations grew 12% quarter-over-quarter (Q/Q) and 31% year-over-year (Y/Y). This represents the fourth quarter in a row of steady, incremental increases in residential installations in the U.S. While the residential market remains the smallest segment in terms of volume, it has also shown the least volatility over the past three years. As noted in previous reports, the overarching trend in the residential market is the shift from host-owned systems to third-party ownership through power-purchase agreements (PPA) or lease structures. At least 16 companies offer residential leases/ PPAs, either in their own installations or through partner installers. Many residential integrators now have access to a lease/PPA program of some kind, and customers increasingly select third-party ownership over direct ownership. SolarCity, one of the pioneers of this model, filed to go public in April 2012 and may be among the first pure-play residential solar integrators/financiers to be publicly traded – along with Real Goods Solar, which is currently listed on the NASDAQ.
Non-residential (commercial, government and non-profit) installations grew 14% Q/Q and 77% Y/Y. As was the case throughout 2011, the non-residential market was supported substantially by a rapidly growing New Jersey market (122 MW in Q1 – the first time a single state has installed over 100 MW of non-residential solar in a single quarter). California also had a strong Q1, installing 87 MW. Given the expected downturn in the New Jersey non-residential market and the competitiveness of California, many developers are hoping to find other non-residential growth markets. The full version of this report highlights three states with in which we expect substantial near-term growth prospects in non-residential installations: New York, Massachusetts, and Hawaii.
Utility installations reached 124 MW in Q1 2012 coming from 18 projects.The largest of these projects was the first phase (30 MWac, 34.5 MWdc) of the 290 MWac Agua Caliente project in construction by First Solar. In Q2, another 70 MWac was completed, and the majority of the project is expected to be on-line by the end of 2012. Apart from this, the majority of the utility projects completed in Q1 could be considered wholesale distributed generation, generally defined as a 1MW to 20 MW project connected at the distribution level. This is an increasingly popular tactic with a number of benefits, ranging from fewer land use and permitting issues to easier grid interoperability.
INSTALLED PRICE
Year-over-year, the national capacity-weighted average installed price declined by 17.2 percent to $4.44/W. Q/Q the average system price rose by 8.25 percent. This average number is heavily impacted by the volume of utility-scale installed in a given quarter, and there was substantially less utility-scale solar connected in the first quarter of 2012 compared to the fourth quarter of 2011. It should be noted that prices reported are weighted averages based on all systems that were completed in Q1 in many locations. Average installed price within each market segment fell both quarter-over-quarter and year-over year.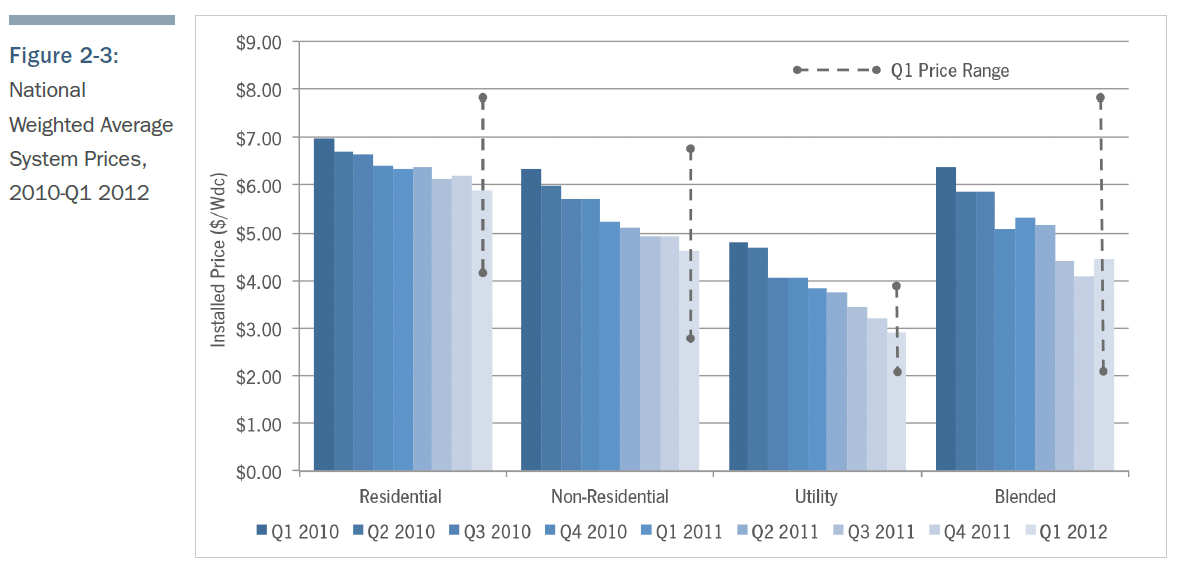
• RESIDENTIAL system prices fell by 4.8 percent from Q4 2011 to Q1 2012, with the national average installed price falling from $6.18/W to $5.89/W. Y/Y, installed costs declined by 7.2 percent. This quarterly decrease is largely a result of price reductions in the major state markets of California and New Jersey, though many secondary markets witnessed price drops as well. With the exception of a few regions which can sustain higher installed costs, engineering, procurement, and construction (EPC) costs in established markets are typically in the mid-$4-per-watt range. With developer margins and financing costs stacked on, average prices climb into the $5 to $6 per watt range. States with solar carve-outs saw a noticeable drop in prices, largely necessitated by the decreasing value of solar renewable energy credits (SRECs).
• NON-RESIDENTIAL system prices fell by 6 percent Q/Q, from $4.92/W to $4.63/W. Year-over-year, installed costs declined by 11.4 percent. New Jersey, the largest non-residential state market in Q1, led the low-cost charge as developers worked hard to mitigate plunging SREC prices. The same was seen in DE, MA, and MD, but on a less drastic scale. For projects in excess of a few hundred kilowatts, EPC costs have fallen to the mid-$2-to-$3-per-watt range. Moreover, larger, well established installers increased their competitiveness by buying significant quantities of low-cost modules on the spot market or via short-term supply agreements.
• UTILITY system prices declined for the eighth consecutive quarter in a row, dropping from $3.20/W in Q4 2011 to $2.90/W in Q1 2012. This 9.4 percent quarterly reduction is largely a result of low-cost modules continuing to be available in significant quantities. Y/Y, installed costs declined by 24.7 percent. The four largest projects that came online in the first quarter, all in excess of 10 MW, used an even split of low-cost Chinese-made c-Si or CdTe panels.
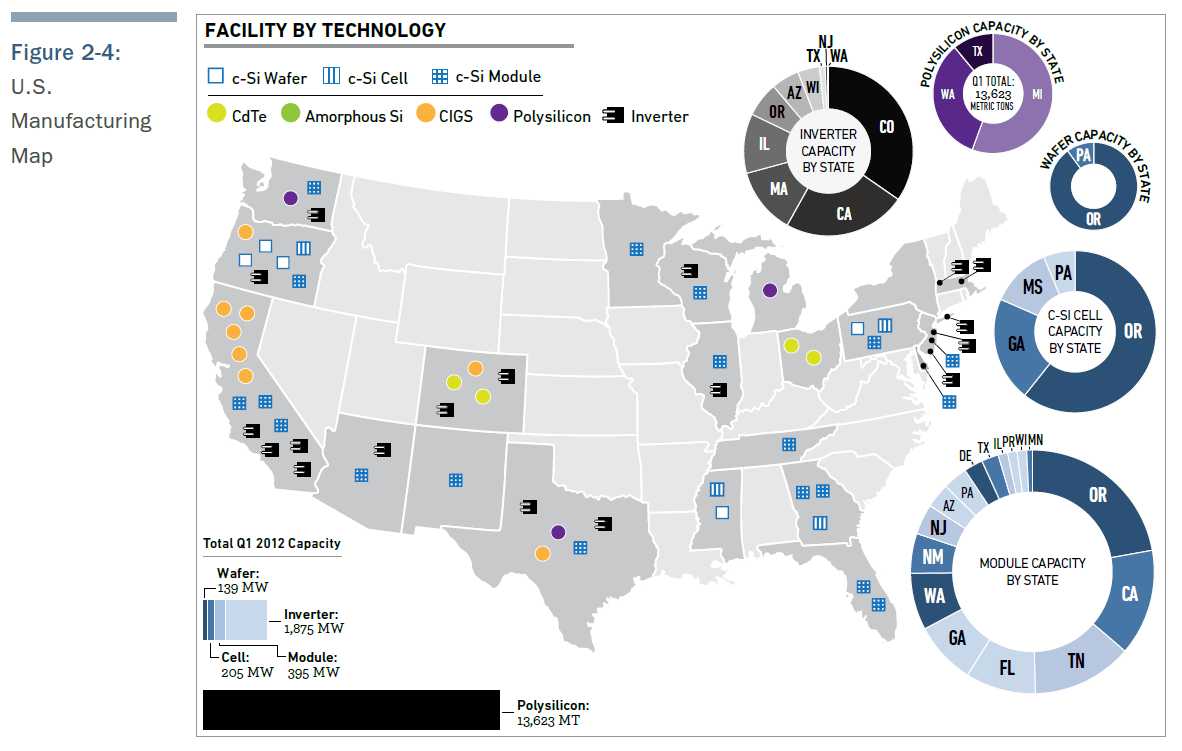
COMPONENT MANUFACTURING AND PRICING
Pricing for polysilicon and PV components continued to exhibit softness in Q1 2012 due to the persistence of the global oversupply environment that the industry has faced since early 2011. Blended polysilicon prices declined by 12 percent to $38/kg. Price drops for wafers, cells and modules were steeper at 18 percent quarter-over-quarter. Blended module ASPs for Q1 2012 were down to $0.94/W, a staggering 47 percent lower than Q1 2011 levels of $1.78/W.
MARKET OUTLOOK
Early strength in New Jersey, the large volume of safe-harbored modules combined, and positive industry outlooks for California, Massachusetts, and Hawaii suggest that 2012 will be a stronger year for installations than previously anticipated. As such, total installations could reach 3.3 GW this year. 2013, however is an open question. The impacts of the import tariff on Chinese cells, as well as the expiration of the 1603 Treasury Program, will be felt most next year. This could coincide with the trough of demand in New Jersey and California’s adjustment period into a post-CSI world to create a temporary slow-down of growth in that year. The market should regain its momentum thereafter and continue along its path to become a global PV market leader by 2015.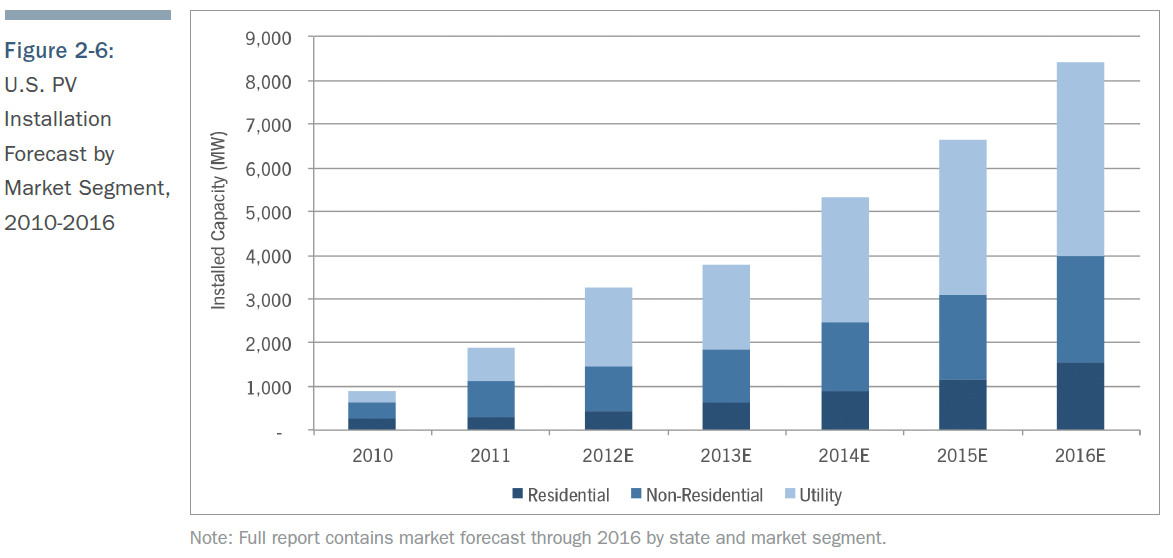
CONCENTRATING SOLAR
INSTALLATIONS
Q1 2012 saw just one 20 kW concentrating PV (CPV) project completed. There were no concentrating solar power (CSP) projects completed in Q1 2012. While less than 1 MW came on-line in the first quarter, there was additional progress on several of the large concentrating solar projects under development.Significant developments in Q1 2012 include:
• Abengoa’s Solana Generating Station received a $125 million investment from Capital Riesgo Global, a subsidiary of Banco Santander, for an equity stake in the project.
• Construction of the Power Tower at the Crescent Dunes Solar Energy Project was completed in February 2012.
• SolarReserve’s Saguache Project received its final land use permit from the Saguache County Board of County Commissioners.
• A total of 1.3 GWac of concentrating solar is now under construction
U.S. Solar Market Insight Full Report
Get the latest Strategic Data & Analysis Today!
U.S. Solar Market Insight™ is a collaboration between the Solar
Energy Industries Association® (SEIA®) and GTM Research that brings
high-quality, solar-specific analysis and forecasts to industry
professionals in the form of quarterly and annual reports.
Each quarter, GTM Research gathers a complete account of
industry trends in the U.S. photovoltaic (PV) and concentrating solar
power (CSP) markets via comprehensive surveys of installers,
manufacturers, utilities and state agencies. Annually, we supplement our
PV and CSP analysis with coverage of the latest in the solar hot &
cooling (SHC) and solar pool heating (SPH) markets. The result is the
most relevant industry data and dynamic market analysis available.
The U.S. Solar Market Insight™ Reports are offered in two
different versions– the Executive Summary and Full Report. The Full
Report is available individually or as part of an annual subscription.
Please find a description of each publication below, or click here to
see our quarterly report Table of Contents by solar technology.
Figure: 2011 Year-in-Review

Source: GTM Research and SEIA
Executive Summary
Each quarter's Executive Summary provides a general breakdown of the current state of the PV, CPV and CSP markets in the U.S. Executive Summaries feature the following level of analysis and detail:
- National aggregate capacity additions
- National weighted average installed price
- National aggregate number of installations
- National aggregate manufacturing production
full report contents
The quarterly Full Reports are comprehensive, timely perspectives on the PV, CPV and CSP sectors. These versions are approximately 70 pages in length and include all the data and analysis from our Executive Summary plus incisive, state-level breakdowns of installations, costs, manufacturing and demand projections. The full reports feature the following:
- Installations by market segment for the top 23 states
- Manufacturing capacity & production by component by state
- Installed cost by market segment for each state
- Demand projections to 2016 by technology, market segment & state
- State-by-state strategic market analysis
- Component pricing across the value chain
Download a free copy of this quarter's Executive Summary today.
 download
CCRES special tanks to
SEIA
Established in 1974, the Solar Energy Industries Association
(SEIA) is the national trade association of the U.S. solar energy
industry. Through advocacy and education, SEIA is building a strong
solar industry to power America.
As the voice of the industry,
SEIA works with its member companies to make solar a mainstream and
significant energy source by expanding markets, removing market
barriers, strengthening the industry and educating the public on the
benefits of solar energy.
SEIA is a 501(c)6 non-profit trade association. Our sister organization, The Solar Foundation,
a 501(c)3 non-profit charitable organization, oversees policy-driven
research and develops education & outreach programs to promote the
further development of solar energy in the U.S.
In January 2012,
SEIA merged with the Solar Alliance, an advocacy organization working to
establishing solar policies at the state level. The two organizations
now operate under the SEIA brand in order to present a unified solar
industry voice in all state and federal advocacy efforts.
If your
business is involved in solar energy in the U.S., joining SEIA can help
give you the tools you need to succeed in a rapidly-changing market,
including:
- Powerful advocacy - SEIA's government affairs staff works with state and federal policymakers to pass pro-solar, market-based policies to help your business grow
- Comprehensive market research - Along with our partners at GTM Research, we provide information on the full supply-chain for the domestic market through the U.S. Solar Market Insight Report
- Industry networking - Connect with solar industry veterans and entrepreneurs at our exclusive networking events and B2B trade shows like PV America and Solar Power International, produced with the Solar Electric Power Association (SEPA)
- Public relations - SEIA works to highlight positive stories about solar energy and promotes industry news to members of the press
Croatian Center of Renewable Energy Sources (CCRES)
Profesionalna usluga hidroizolacije temelja uz korištenje najnovijih tehnologija i kvalitetnih materijala.
OdgovoriIzbriši